Beginning of Freedom - Issue #70
Rollercoaster weekend before Tuesdays CPI with the forecast for 6.0% Yoy.
Fundamental overview
The past few days have been such a rollercoaster ride that tomorrow’s CPI print for February feels unimportant in comparison. So, to first get that out of the way, the forecast for YoY CPI is 6.0% (vs. 6.4% for January). You know the drill: higher than expected inflation is very bad, while lower is good for risk-on assets, due to how the data is likely to influence Fed policy. Now, with that covered, let’s get to the bit that’s way more fun (or terrifying—depending on which stablecoins you had your money in).
As you probably know, the one stablecoin that no one expected to ever deviate from its peg did just that over the weekend. On Saturday, USDC hit a low close to 80 cents, and only just recently recovered to back above $0.98. In the couple of days that the trusted blue stable was neither trusted nor stable, all hell broke loose in DeFi, with more or less every stablecoin except USDT losing its peg. So how and why did all this happen?
The key player here is Sillicon Valley Bank (SVB), which came down with a very sudden case of insolvency on Friday. In what is the second biggest bank failure in US history, the bank faced a run on its deposits, most of which were uninsured. In case you’re not familiar with US banking regulations, the FDIC (Federal Deposit Insurance Corporation) guarantees that all depositors in insured banks will be made whole in the event of insolvency, but there’s a catch: the insurance only covers $250k per depositor. Everything over that amount (85% out of the approximately $175 billion held at SVB) is uninsured, and while it seemed likely that most of the depositors would still be made (at least almost) whole eventually, the problem was that many of the bank’s clients were tech firms.
Even if those tech companies knew that they would get their money at some point, that was of little help when they had payrolls that they wouldn’t be able to meet this week. The consequences of that would have been unprecedented, with an immense number of jobs (primarily in tech startups) that would have been wiped out overnight. Luckily, the Treasury Department, the Fed and the FDIC stepped up and issued a joint statement on Sunday that all SVB depositors will be made whole, regardless of the deposit amount.
Now what does all that have to do with USDC? The thing is, Circle (the issuer of USDC) had $3.3 billion of USDC reserves—out of the total $40 billion—at SVB. To make matters even more interesting, it was quickly revealed that Circle initiated a transfer of those funds out of SVB on Thursday, one day before the bank shut down. This fueled a bounce in USDC, as it was still likely that their transfer will be processed normally in the coming business days, because it was initiated before operations at SVB were halted. Now, with the Fed/FDIC move, this is largely irrelevant, but the overall panic that the entire crypto space was in over the weekend was incredible. I’ll cover more on this below—first, let’s see what the charts say.
Bitcoin
Well quite a fun weekend, don’t you think?
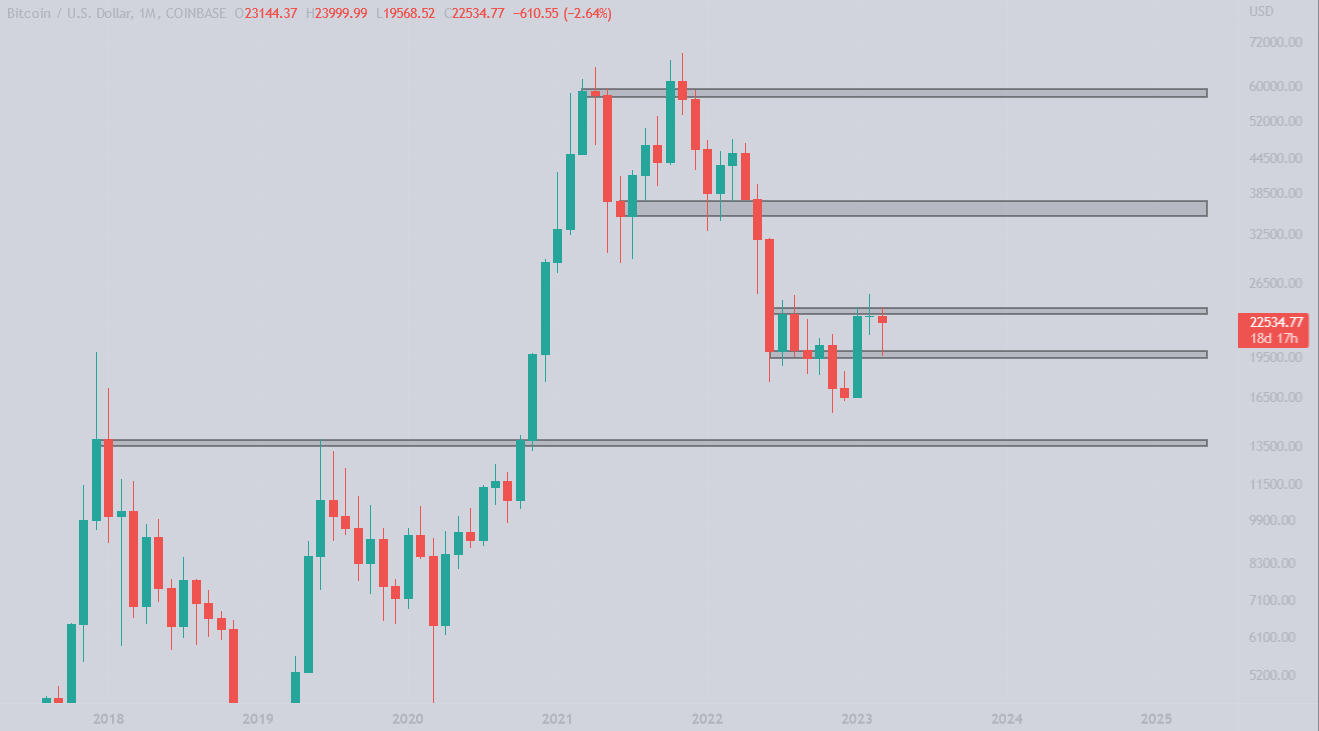
Crypto Twitter went from “we are going to 0”, to “we are baaack baabbby” in a matter of hours. The monthly chart stays in the range and back under resistance. We can see that it retested the monthly level that acted as support back in the summer of 2022. Given the events that went on since Friday, I think bulls can be happy that the $20k level was defended, for now.
Bitcoin bounced around the 2017 all time high level, which can be seen on the daily timeframe. The uptrend structure that had two higher lows, trying to form the third, was broken. It is hard to do any technical analysis at the moment as the market is heavily sentiment-driven. The low that was currently made was due to the Silvergate and Sillicon Valley Bank fiasco.
If we discussed $22,500 being a support on the way down, we cannot ignore it on the way up. A close above $22,500 is needed and then we can argue that $24,500 (summer range high and monthly resistance) is on the menu.
It all comes down to stocks and what will happen after US open.
SPX, Gold and DXY
SPX is breaking below our “magic” trendline, which is not weird given the previous weeks events. The last hope for bulls right now is that a higher low is formed along with an immediate recovery above the trendline, which would make this breakdown a fakeout.
Gold is moving again.
No wonder when investors see tough times they stick to gold. Can’t help but wonder whether that’s the reason for the recent Bitcoin pump as well. Many consider it as digital gold, meaning investor could park capital into it similarly to how they do with gold. From a technical perspective, the 1810 level seems like a strong support at the moment after another test and a 5% bounce from it.
The US Dollar Index has rejected at the important 105 level which is a good sign for risk-on assets. This will be a must-monitor chart for the upcoming week. DXY will drop further down if there’s more contagion from SVB and the prospect of bailouts. For now it’s right at support, so put it on your watchlist.
Ethereum
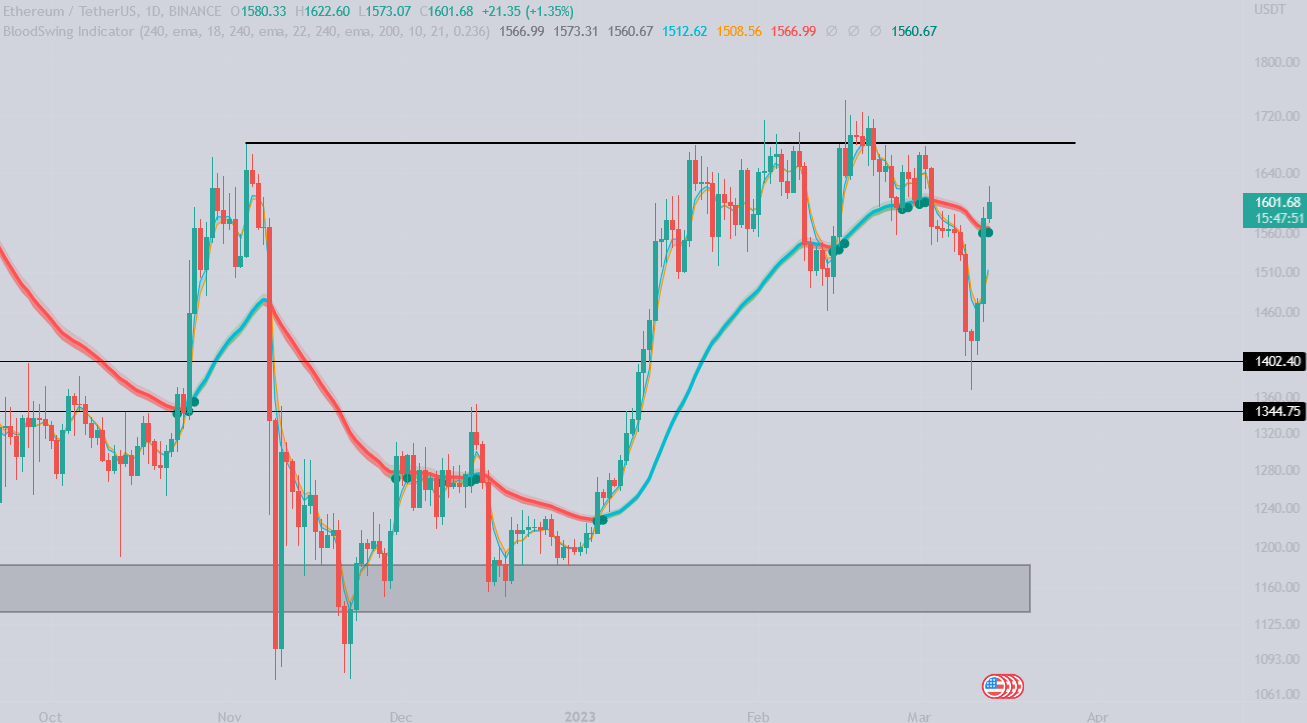
As mentioned in the previous letter $1350–$1400 is a must-hold level for bulls to see continuation.
The level in question is the 2018 all time high, which acted as a support similarly to Bitcoin’s 2017 all time high. With the Shanghai upgrade coming soon, bulls are more than happy to see that level hold. Moreover, you can also see that the daily candle has closed above the Bloodswing Indicator which is a sign of continuation. However keep in mind that $1700 has been a tough nut to crack as it was tested a quite a few times now, making it a psychological level as well.
Blood’s content recap
Trading Plan Alpha from my private book
“Name it however you want, but the idea is that you set a few rules you ALWAYS stick to.
Why?
1. You take risks inside a preset structure. This separates traders from gamblers
2. Minimizes the effect of future emotions
“
Trading Tip
“ Mastering only charting or only researching results in failure.
FA trader finds good coins but buys under resistance.
TA trader has clean charts, but buys wrong coins.
1. Master FA to find good coins
2. Master TA to find entries
Be ready till end of March
GO “
Concluding notes
At this point you might be wondering why the USDC situation made everyone worried about the potential mayhem it could cause all across DeFi. It’s a systemically important stablecoin, of course, but why would that impact lending and borrowing protocols, for example?
The thing is, USDC was so trusted that some developers simply decided to hardcode that “USDC=$1” in the protocols themselves, unlike with other assets, where protocols rely on oracles to get price feeds from multiple liquid markets. One example of this is MakerDAO, the issuer of DAI, which also fell as low as USDC, even though USDC wasn’t its only type of collateral. Because USDC was hardcoded to be worth $1.00, it was impossible for DAI to be worth more than USDC, although it also had other assets backing it. MakerDAO is far from the only protocol to do that, but luckily USDC didn’t fall low enough for a true DeFi cataclysm to happen.
In conclusion, I’d like to point out a few things about the right way to look at a situation like this. Over the weekend, I’ve seen two types of bad takes: (1) people saying that you should go levered long on USDC with both kidneys as collateral if necessary and (2) others saying that buying USDC around $0.9 is dumb because it’s a bad risk/reward trade (you can lose your whole investment but you can’t possibly make more than 10%).
Both of those are wrong, because both ignore probabilities. First of all, using leverage is not even close to a “risk-free trade” (as if such a thing even existed). If you use derivatives to long USDC, there’s no guarantee that it won’t dip much lower and stop you out, even if you were right about it recovering eventually. Also, while USDC regaining its peg was almost certain, the key word here is almost. If you go all-in, you only need to be wrong once.
On the other hand, saying that buying USDC is dumb because of the risk/reward ratio completely misses the whole point of R/R ratios. What matters isn’t just that one number, but also the probability of both possible scenarios. Multiplying the potential profit and loss with their respective probabilities gives you the expected value (EV) of the trade, a much more important datapoint than just the R/R ratio. To take a simplified example: if you can only gain $100 while risking $1,000, but the probability of winning is 99%, you’d be dumb not to take that trade, although it still might not be a good idea to do that with all of your capital.


